
OZE Visualization
Wind and sun
in a single photo.
Wind turbines and solar PV farms placed together on the same field photograph. The plugin enables analysis of the cumulative landscape impact of wind turbines and solar PV farms – straight from the project layers in QGIS.
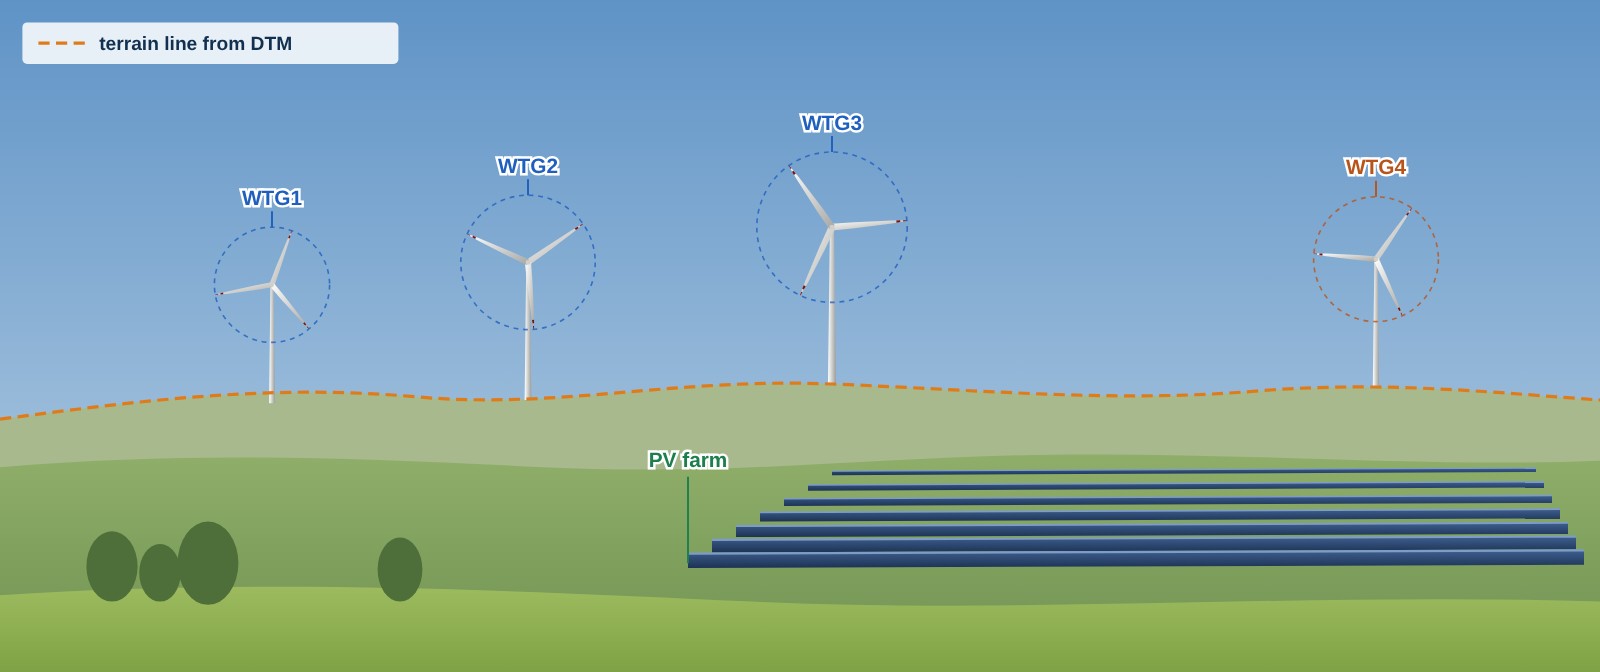
Illustrative diagram – an illustration of how it works, not a screenshot of the plugin.
Cumulative impact
The whole investment in one frame
When wind turbines and solar PV farms are planned in the same area, their landscape impact has to be assessed together. OZE Visualization overlays both types of installation on the same photo, with the same camera settings – so you can see how the whole will look from where the observer stands.
You can show turbines only, PV module rows only, or both at once – also from several layers at the same time, e.g. planned and existing installations.
What the plugin does
Four tools in one plugin
Turbine silhouettes on the map
For each turbine in a point layer, the plugin draws a silhouette to scale on the map, based on the hub height and blade length.
PV rows from the farm outline
From a solar PV farm polygon it generates module row lines – with the selected orientation, spacing and optional division into modules.
Shared photo calibration
It overlays turbines and PV row walls on a photo or panorama, which you match to the frame, and then renders their appearance.
Combined PDF report
From the saved views it assembles a single document with an overview map and a separate page for each photo point.
Photo calibration
From photo to visualisation in a few steps
- You select the camera point. You click a location on the map or select a point from the photo points layer.
- You choose what should appear in the photo. Turbine layers, PV row layers, or both.
- You adjust the “camera” with sliders. You change azimuth, tilt, roll, field of view and camera height live – turbines, PV rows and the terrain line from the DTM move together.
- You render and correct. Separate erasers for turbines and PV walls let you remove the parts hidden by trees or buildings without affecting the other type of installation.
- You save the image and the calibration. The point settings, together with the erased parts, are saved in the project for later editing.
Turbines and photovoltaics
Each type of installation shown in its own way
- turbine lighting according to the date and time of the photo
- manual correction of the terrain line
- reference points and lines
- panorama direction arrow on the map
- rows from one or more line layers
- separate colour for the front and back of the modules – custom or from the layer colour
- adjustable transparency
- row height and angle and division into modules
PDF report
PDF report in a few clicks
You select the saved photo points, and the plugin restores their calibration and assembles them into a single PDF file – with turbines, PV rows or both at once.
Overview map
One shared page with the location of turbines, PV farms and all photo points.
Panorama for each point
A separate page with the rendered panorama – turbines and PV rows together, just as in the calibration window.
Tables and location map
Tables of turbines and PV rows visible in the frame, with azimuth and distance, and a location map with objects inside and outside the frame.
What you need
Data you usually already have
Turbines and/or PV farms
Turbine point layers with hub height and blade length, and PV farm polygons or ready-made row layers.
Photos
Field photos or panoramas and – optionally – a layer of the points from which they were taken.
DTM
A Digital Terrain Model raster to determine the terrain line and the elevation of objects.