WTG Noise
Wind farm noise.
In QGIS. In a minute.
Calculations according to ISO 9613-2:2024 with the full Annex D for wind turbines – directly on your layers in QGIS, with no separate noise software.
* NATURO in-house test; the time depends on the computer, the size of the area and the calculation settings. Details below, in the “Speed” section.
Compliance with the latest standard
Annex D of ISO 9613-2:2024 – complete and ready to use
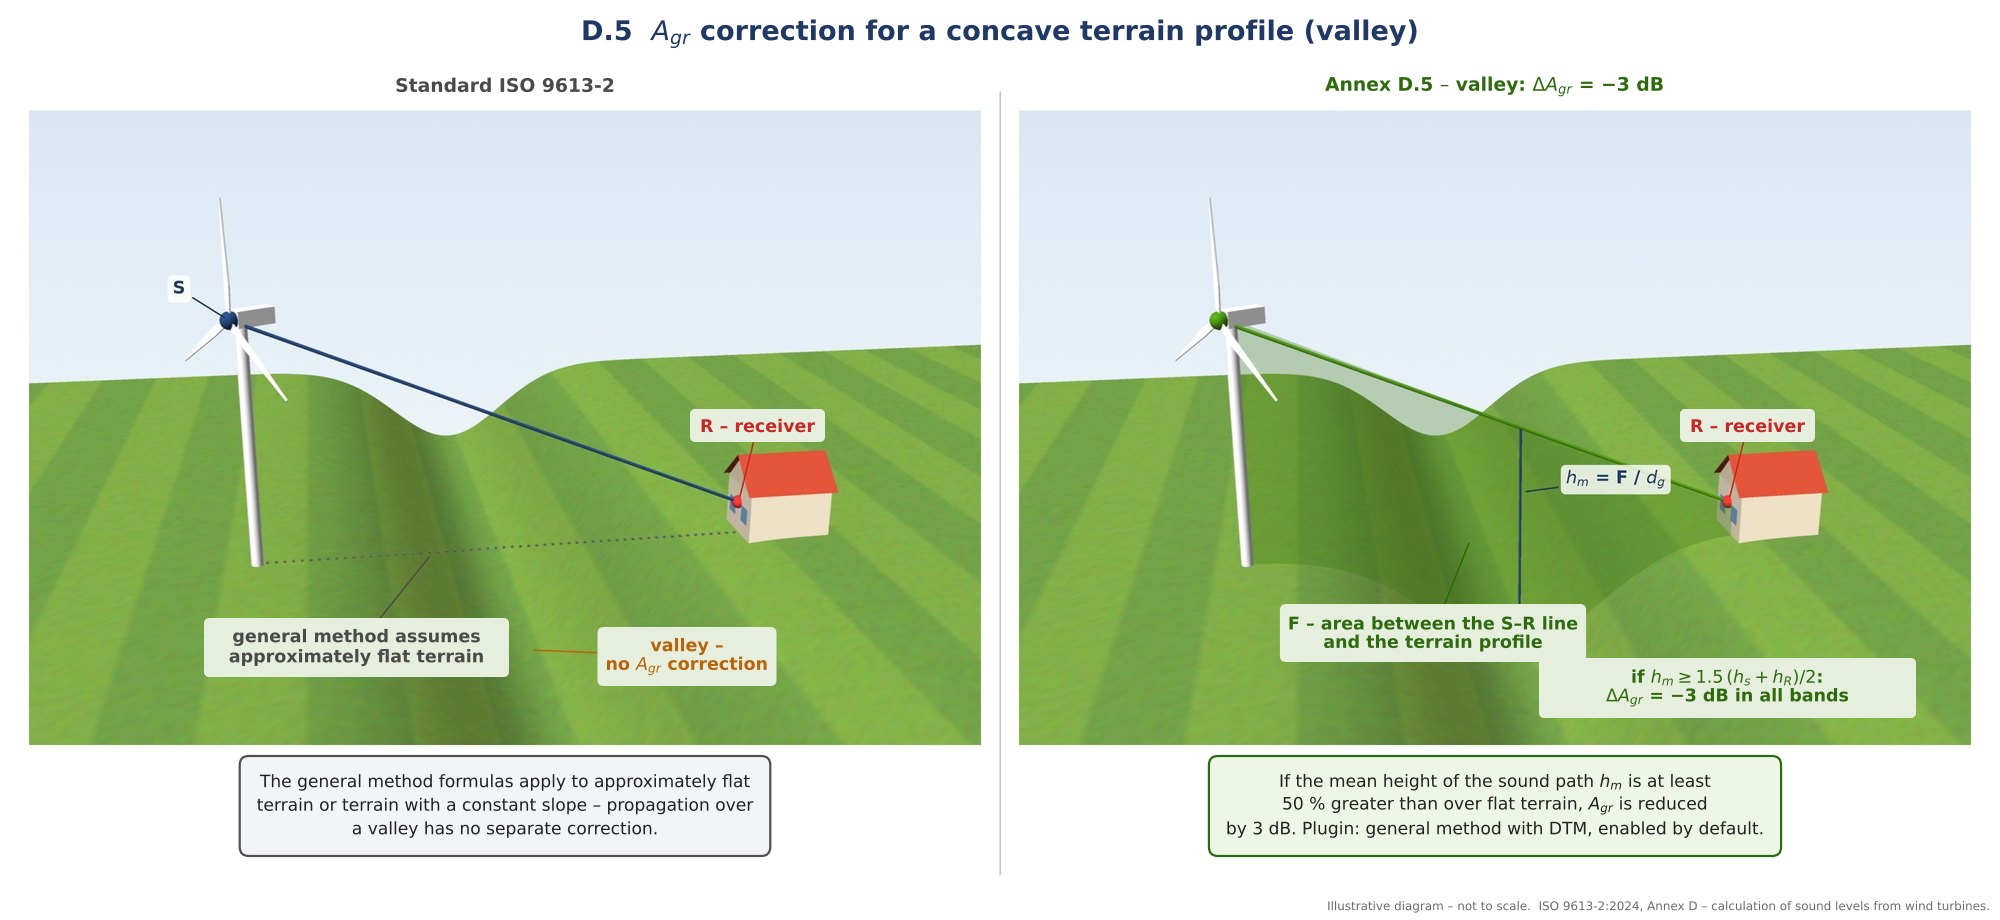
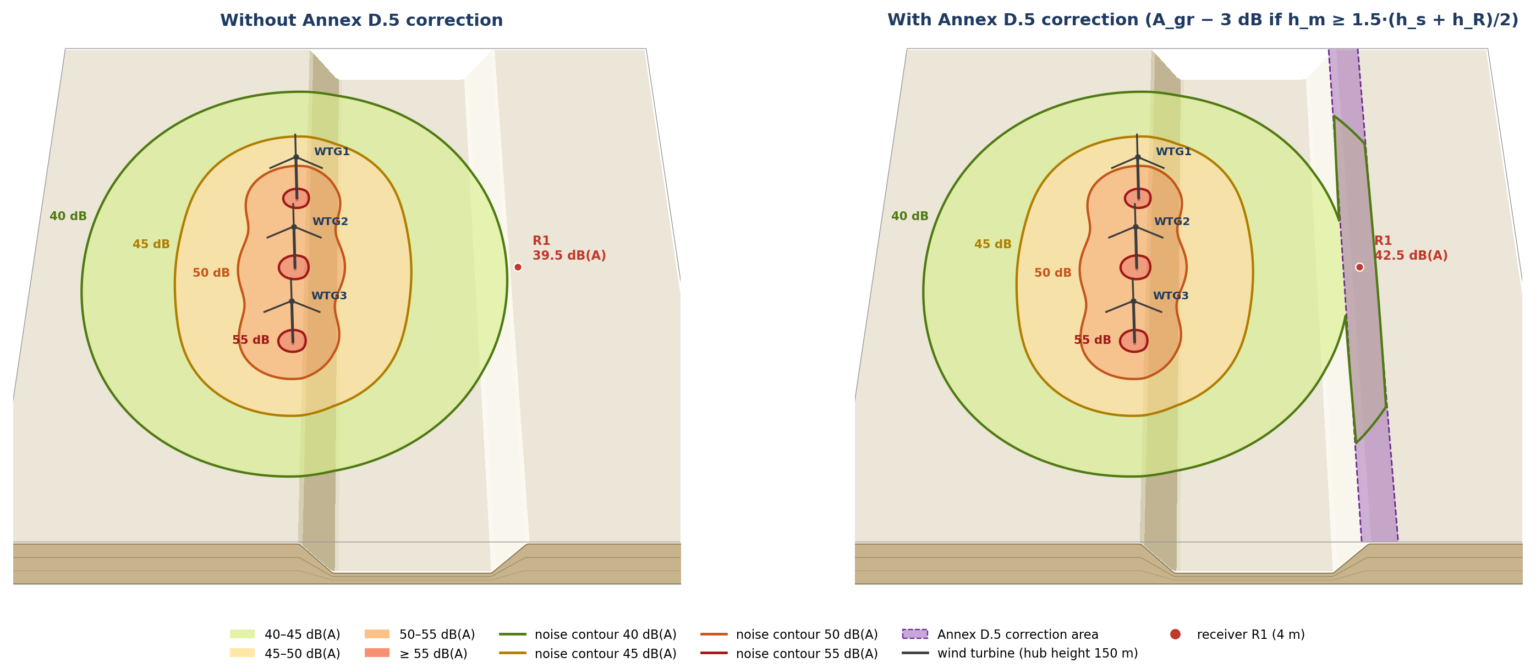
The 2024 edition of ISO 9613-2 for the first time includes a dedicated Annex D with an extended methodology for calculating wind turbine noise. Software released earlier cannot take it into account, and not every current release – especially basic packages – supports it in full. WTG Noise includes all of its elements, enabled by default and described in the report.
Check your software
| Clause | What it covers | WTG Noise | Your software |
|---|---|---|---|
| D.3 | Terrain screening limited to 3 dB or calculated for the blade tip (hub + rotor radius) | ✓ | ☐ |
| D.5 | −3 dB correction for a sound path over a valley, determined automatically from the terrain profile (DTM) | ✓ | ☐ |
| K_geo | New correction of the 2024 edition in the general method for sources located high above the ground | ✓ | ☐ |
For comparisons and for reproducing older studies, the following are also available: ISO 9613-2:1996, the alternative method (7.3.2) and the German LAI interim method – selectable in one window.
Speed
An hour of calculations turned into a minute
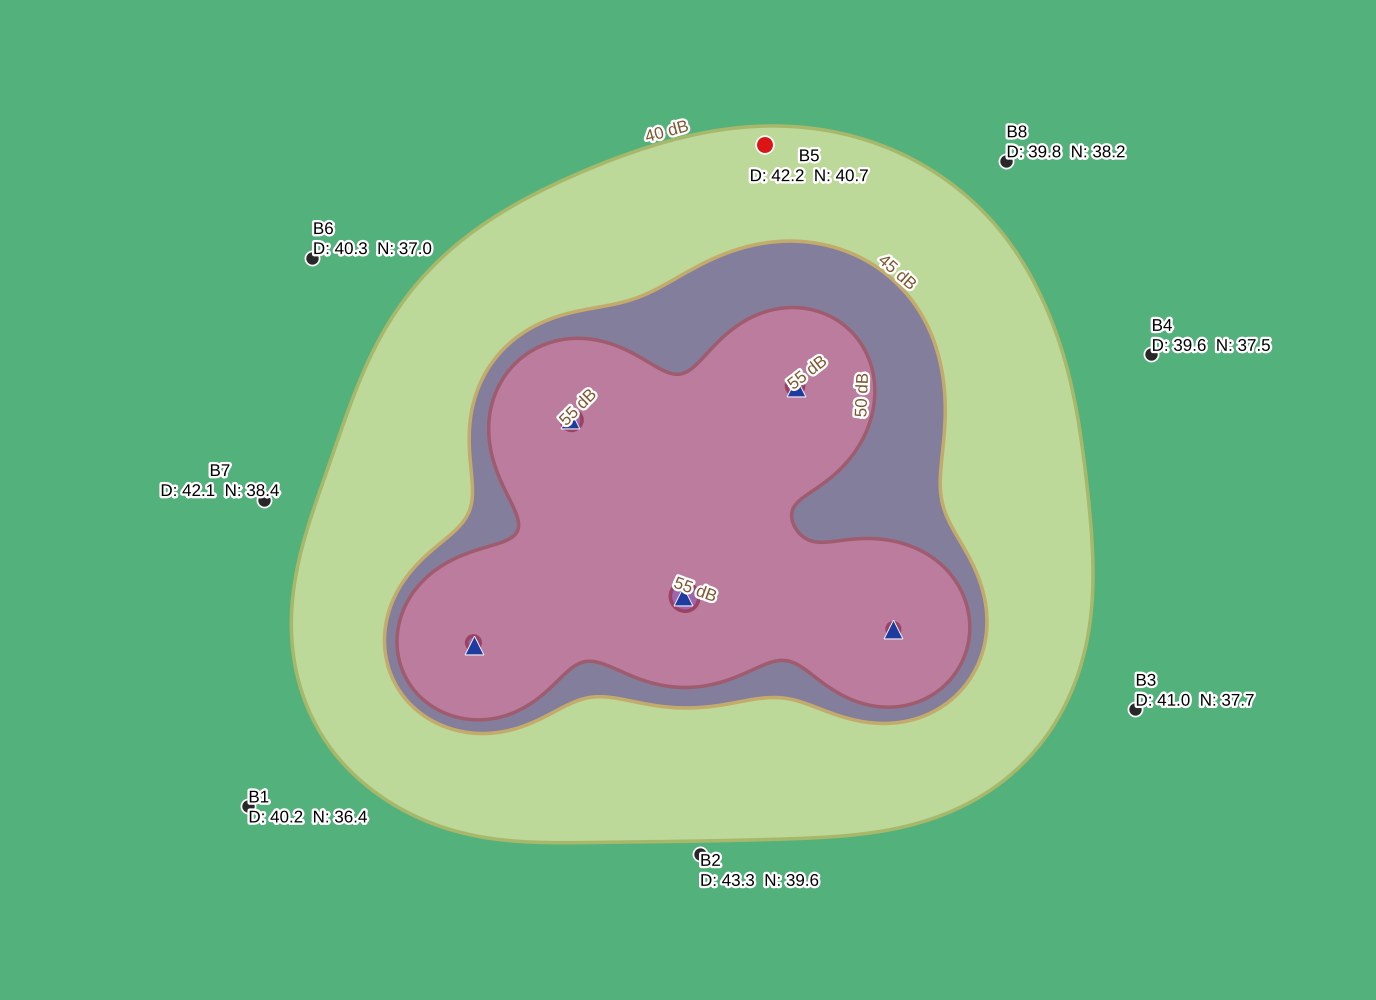
NATURO in-house test: 12 turbines, area approx. 9 × 11 km, 10 m grid – approx. 1 million calculation points, 40 and 45 dB(A) noise contours.
Where does the difference come from?
A model tailored to turbines
For turbines in open terrain, ISO 9613-2 reduces to analytical formulas. The plugin calculates them directly – with the same attenuation components – without a universal engine designed for complex scenes with buildings and reflections.
The whole grid at once
Vectorised calculations: millions of turbine–point pairs computed simultaneously in compiled numerical code, instead of point-by-point loops.
Terrain without building a model
The DTM is resampled once to the calculation step, and terrain profiles are read directly from the raster – with no triangulation or 3D model preparation.
Working in QGIS
No moving data between programs
Usually
With WTG Noise
Changing a turbine location or operating mode? You move the point or change the spectrum in the attribute table and recalculate. Another variant is just a new file prefix – the plugin remembers all settings.
More benefits
Everything a wind farm designer needs
PDF report in a few clicks
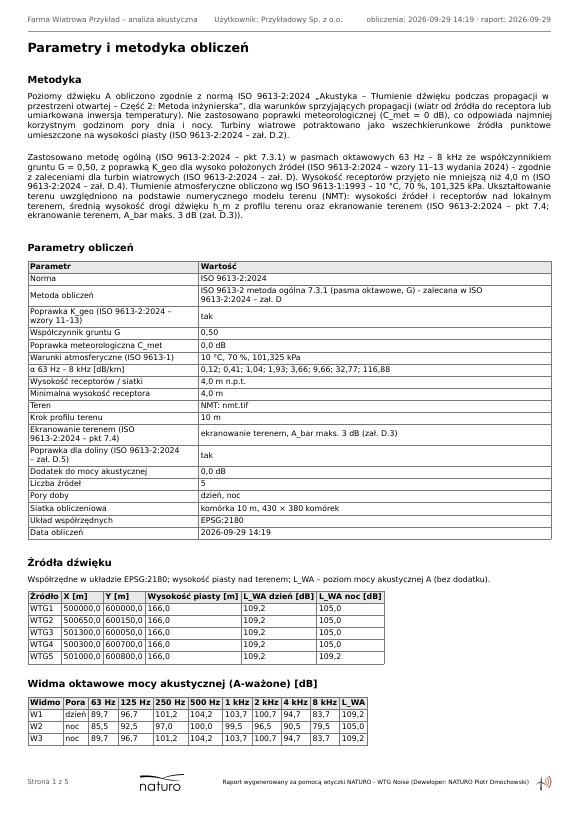
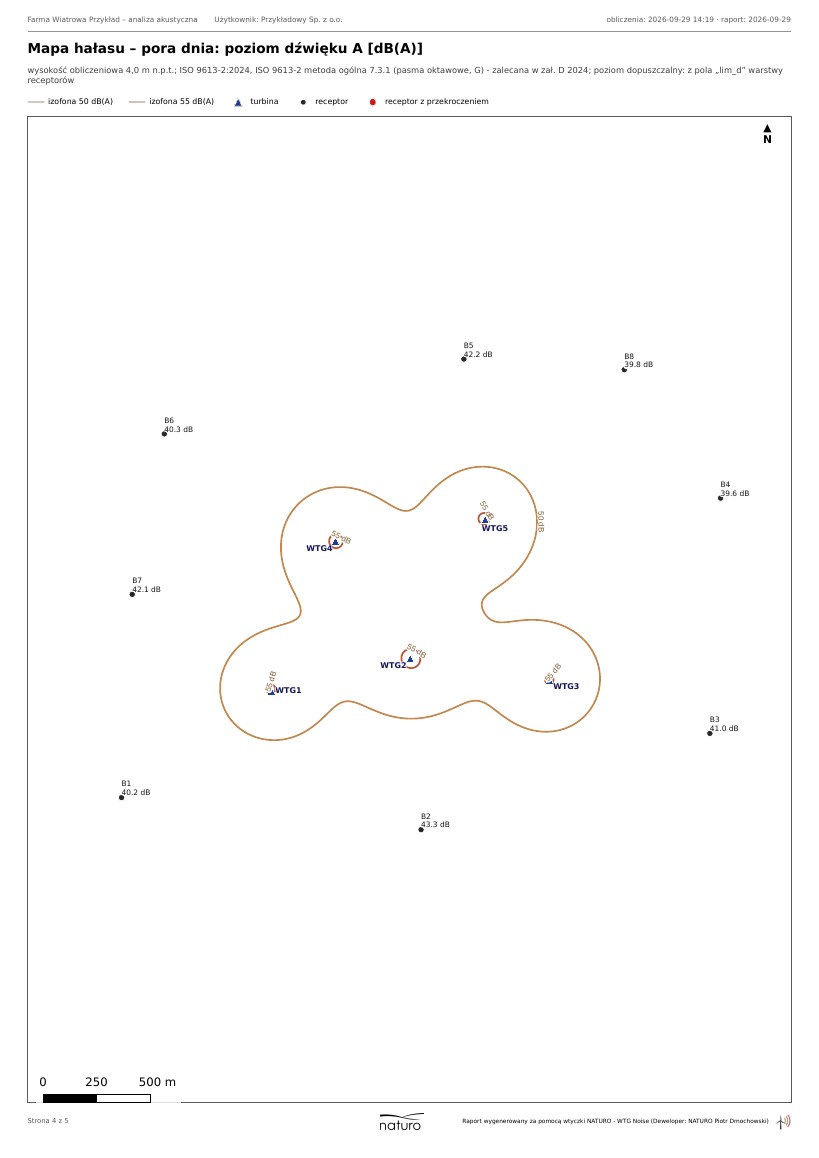
Methodology with references to the clauses of the standard, result tables with highlighted exceedances, day and night maps in A4–A1 format.
Full transparency of calculations
For each turbine–receptor pair: distance and all attenuation components in octave bands. Every result can be checked.
Verified results
Noise contours consistent with a recognised commercial program to within 0.01–0.05 dB. A declaration of conformity of the calculation model with ISO 9613-2 is available.
Day and night in one run
Separate spectra for operating modes, limit values from layer fields, exceedances immediately visible on the map and in the table.
Cumulative impact
Several turbine layers at once – planned and existing – showing the contribution of each turbine to the noise level at each receptor.
Data you already have
Spectra from Excel or CSV, DTM from any raster, WMS basemaps and orthophotos; results as GeoPackage, GeoTIFF and CSV.
No additional software
Works in free QGIS from version 3.16, ready for QGIS 4. Three commands in one menu – quick to learn.
In Polish and English
The plugin is available in both languages. Support directly from the plugin author.
Sample report
A report with your project name in the header
Parameters and methodology, results at receptors with a map, turbine contributions and noise maps for day and night – in your project.