

WTG Visualization
Turbines in the photo,
before they stand in the field.
Silhouettes of wind turbines on the map and on field photographs – taking into account the terrain relief, the position of the sun and the actual dimensions of the turbines. Straight from the project layers in QGIS.
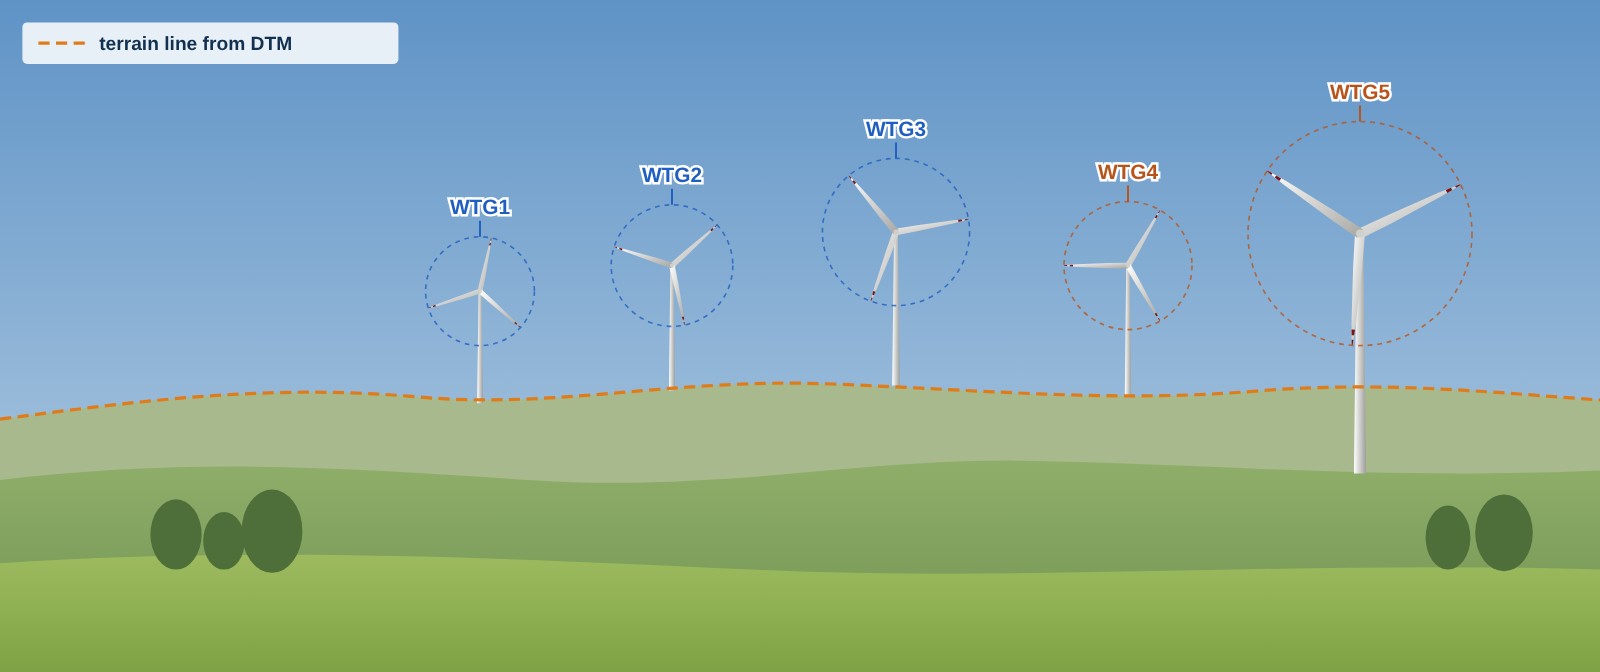
Illustrative diagram – an illustration of how it works, not a screenshot of the plugin.
What the plugin does
Three tools in one plugin
Turbine silhouettes on the map
For each turbine in a point layer, the plugin draws a silhouette to scale on the map, based on the hub height and blade length.
Turbines on a field photograph
It overlays projected turbine silhouettes on a loaded photo or panorama, which you match to the frame, and then renders their full appearance.
Combined PDF report
From the saved views it assembles a single document: an overview map and a separate page with a panorama for each selected point.
Photo calibration
From photo to visualisation in a few steps
- You select the photo point and the turbine layers. The photo can be assigned to the point in an attribute or selected manually.
- You adjust the “camera” with sliders. You change azimuth, tilt, roll and field of view live, until the silhouettes and the terrain line from the DTM match what is visible in the photo.
- You fine-tune the details. You can correct the terrain line by dragging its points – the turbine bases then “sit” on the corrected terrain. Your own reference points and lines, such as masts or roads, also help.
- You render the turbines. The plugin draws full silhouettes with blades and warning stripes. With an eraser you remove the parts hidden by trees or buildings.
- You save the image and the calibration. You save the finished visualisation as an image, and the point settings in the project, for later editing.
Turbine appearance
Light as on the day the photo was taken
Based on the date, time and location of the photo point, the plugin calculates the position of the sun. In the “Sunny” setting each turbine has a lit and a shaded side – depending on where the light comes from relative to the viewing direction. The “Cloudy” setting gives diffuse light, and for individual turbines you can manually specify the side the light should come from.
The rotor is always shown facing the observer, regardless of the actual wind direction.
The calibration assumes a panorama with a cylindrical projection (not a “fisheye” lens).
More benefits
Everything in one QGIS project
Several turbine layers at once
Planned and existing turbines from different layers in one photo, with labels in the colour of the layer the turbine comes from.
Which turbines are in the frame
The plugin calculates which turbines fall within the frame of the photo, and gives their azimuth and distance in the report.
Labels that do not overlap
When many turbines are close together, the labels are placed jointly so that they do not overlap or extend beyond the frame.
Full calibration saved in the project
Camera settings, lighting, terrain correction and erased parts are saved for each photo point. You load them with one button.
Panorama direction on the map
Each saved calibration creates an arrow showing the photo direction in a separate layer, labelled with the point name.
Remembers your settings
The most recently selected layers and fields are remembered, also between QGIS sessions.
PDF report
PDF report in a few clicks
You select the saved photo points and their order, and the plugin assembles them into a single PDF file. Each page includes the plugin icon and the author’s signature.
A3 overview map
Turbine locations, panorama points and photo directions, with a legend, scale bar and north arrow. Page orientation is selected automatically.
Panorama for each point
A separate landscape A3 page with the rendered panorama – exactly as when saving the image manually.
Location map and turbine table
Below the panorama, a location map with the camera direction and a table of turbines visible in the frame, with azimuth and distance.
What you need
Data you usually already have
Turbine layers
One or more point layers with hub height and blade length.
Photo points and photos
A layer of points from which the photos or panoramas were taken, and the JPG or PNG files themselves.
DTM
A Digital Terrain Model raster to determine the terrain line and the elevation of turbine bases.